What to Make of Credit Downgrades for the U.S. and Its Banks
In early May, the company Fitch Ratings put out a press release warning of a potential downgrade to the U.S.’s sterling AAA credit rating. Fitch was responding to the debt ceiling drama as it unfolded, attaching its name to the largely misguided narrative that the U.S. was charging towards a debt default.1
Now, nearly two months after a debt ceiling deal was struck – and with worries about debt default gone – Fitch made its splash in the news cycle by lowering its rating on the U.S. to AA+, one notch down from the top AAA grade.
If investors were expecting the downgrade to be accompanied by new revelations about the U.S.’s fiscal standing, they were greatly disappointed. Instead, Fitch Ratings cited the debt ceiling drama, Congressional Budget Office debt and deficit forecasts, Social Security and Medicare funding, the 2017 tax cuts, and high government spending as the causes for concern.
In other words, it was a collection of information that markets and investors have long, long known and understood.
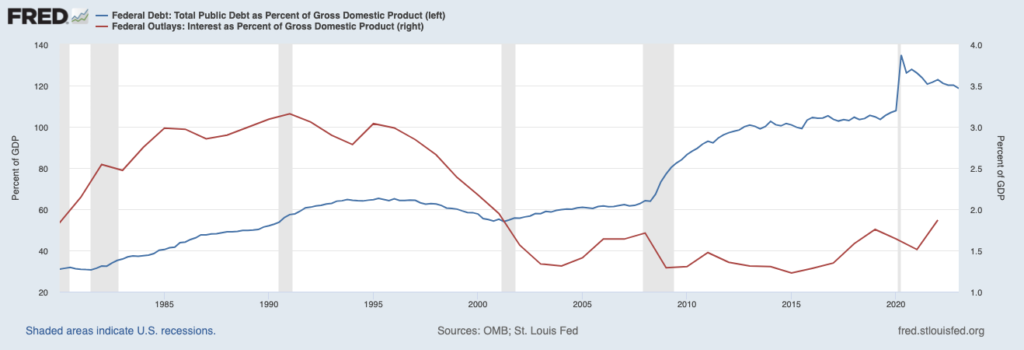
To be clear, I do not intend to minimize problems the U.S. faces with mounting debt and interest payments. As seen in the chart below, total debt as a percent of GDP (blue line, left axis) has soared since the 2008 Global Financial Crisis, and remains above 100%. That’s too high.
Additionally, interest payments as a percent of GDP (red line, right axis) are still benefiting from a prolonged period of low interest rates, but yields are rising – which means borrowing is becoming more costly. This dynamic of high absolute debt and rising interest rates can restrict the U.S.’s ability to borrow more in the future, which can crimp spending and investing – and therefore impact GDP growth.
Debt as % of U.S. GDP (left axis) and Interest Payments as % of GDP (right axis)
While I think debt and interest cost issues are worth monitoring, I do not think the opinions of ratings agencies should factor much into an investor’s decision-making process. In my view, they lack credibility. You do not need to look very far back in history to understand why. In the spring of 2008, Fitch gave Lehman Brothers’ preferred stock an A+ rating, about a month after Bear Stearns failed. Five months after receiving Fitch’s A+ rating, Lehman Brothers collapsed.
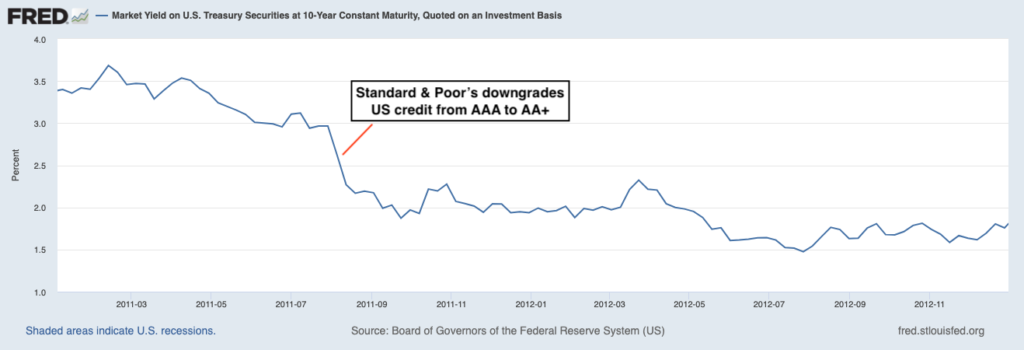
A few years later, 2011’s ‘fiscal cliff’ drama gripped the headlines for months, and Standard & Poor’s – another ratings agency – made waves when they downgraded the U.S.’s debt rating from AAA to AA+. At the time, this felt like a huge deal that could impact the U.S.’s ability to borrow (issue Treasurys) at attractive rates. Logic would say that a debt downgrade should put upward pressure on the cost of borrowing, which would imply rising yields on U.S. Treasurys.
But the opposite happened – yields fell after the downgrade.
Yield on 10-Year U.S. Treasury Bond (2011)
As a follow-on to Fitch’s downgrade of the U.S., Moody’s came out this week and cut the credit ratings on 10 regional banks, while placing six noteworthy financial institutions into ‘review.’ At first glance, many investors might have seen this news and thought that early spring’s bank stress was back. But it turns out that Moody’s downgrades were just a rehashing of the same issues that came to light months ago.
In their report, Moody’s said that rising interest rates “continue to have a material impact on the U.S. banking system’s funding and its economic capital,” adding that higher rates are impacting the value of bonds and other assets on bank balance sheets, leaving lenders with “sizable unrealized losses.” Moody’s also cited risks that a recession could have on loan demand and called out issues in the commercial real estate markets like plummeting demand for office space.
The market has known about these problems for months.
Bottom Line for Investors
Back in May, Fitch rightly characterized the U.S. missing a debt payment as a “very low probability event.” It seemed like an acknowledgment that the U.S.’s issues around debt and obligation payments were more of a political problem than an economic one, which I think is an accurate framing of the issue.
But Fitch issued its downgrade anyway, citing other pieces of dated and widely-known information about taxes, entitlement programs, and CBO budget projections. It’s a delayed reaction based on old news, which I think renders its impact on markets and the economy as insignificant.
An alternate telling of the U.S.’s credit and fiscal standing is not that far away, either. Both Standard & Poor’s and Moody’s continue to give the U.S. the highest possible rating.
Disclosure
2 Fred Economic Data. June 29, 2023. https://fred.stlouisfed.org/series/GFDEGDQ188S#
3 Fred Economic Data. August 8, 2023. https://fred.stlouisfed.org/series/DGS10#
DISCLOSURE
Past performance is no guarantee of future results. Inherent in any investment is the potential for loss.
Zacks Investment Management, Inc. is a wholly-owned subsidiary of Zacks Investment Research. Zacks Investment Management is an independent Registered Investment Advisory firm and acts as an investment manager for individuals and institutions. Zacks Investment Research is a provider of earnings data and other financial data to institutions and to individuals.
This material is being provided for informational purposes only and nothing herein constitutes investment, legal, accounting or tax advice, or a recommendation to buy, sell or hold a security. Do not act or rely upon the information and advice given in this publication without seeking the services of competent and professional legal, tax, or accounting counsel. Publication and distribution of this article is not intended to create, and the information contained herein does not constitute, an attorney-client relationship. No recommendation or advice is being given as to whether any investment or strategy is suitable for a particular investor. It should not be assumed that any investments in securities, companies, sectors or markets identified and described were or will be profitable. All information is current as of the date of herein and is subject to change without notice. Any views or opinions expressed may not reflect those of the firm as a whole.
Any projections, targets, or estimates in this report are forward looking statements and are based on the firm’s research, analysis, and assumptions. Due to rapidly changing market conditions and the complexity of investment decisions, supplemental information and other sources may be required to make informed investment decisions based on your individual investment objectives and suitability specifications. All expressions of opinions are subject to change without notice. Clients should seek financial advice regarding the appropriateness of investing in any security or investment strategy discussed in this presentation.
Certain economic and market information contained herein has been obtained from published sources prepared by other parties. Zacks Investment Management does not assume any responsibility for the accuracy or completeness of such information. Further, no third party has assumed responsibility for independently verifying the information contained herein and accordingly no such persons make any representations with respect to the accuracy, completeness or reasonableness of the information provided herein. Unless otherwise indicated, market analysis and conclusions are based upon opinions or assumptions that Zacks Investment Management considers to be reasonable. Any investment inherently involves a high degree of risk, beyond any specific risks discussed herein.
The S&P 500 Index is a well-known, unmanaged index of the prices of 500 large-company common stocks, mainly blue-chip stocks, selected by Standard & Poor’s. The S&P 500 Index assumes reinvestment of dividends but does not reflect advisory fees. The volatility of the benchmark may be materially different from the individual performance obtained by a specific investor. An investor cannot invest directly in an index.
The Russell 1000 Growth Index is a well-known, unmanaged index of the prices of 1000 large-company growth common stocks selected by Russell. The Russell 1000 Growth Index assumes reinvestment of dividends but does not reflect advisory fees. An investor cannot invest directly in an index. The volatility of the benchmark may be materially different from the individual performance obtained by a specific investor.
Nasdaq Composite Index is the market capitalization-weighted index of over 3,300 common equities listed on the Nasdaq stock exchange. The types of securities in the index include American depositary receipts, common stocks, real estate investment trusts (REITs) and tracking stocks, as well as limited partnership interests. The index includes all Nasdaq-listed stocks that are not derivatives, preferred shares, funds, exchange-traded funds (ETFs) or debenture securities. An investor cannot invest directly in an index. The volatility of the benchmark may be materially different from the individual performance obtained by a specific investor.
The Dow Jones Industrial Average measures the daily stock market movements of 30 U.S. publicly-traded companies listed on the NASDAQ or the New York Stock Exchange (NYSE). The 30 publicly-owned companies are considered leaders in the United States economy. An investor cannot directly invest in an index. The volatility of the benchmark may be materially different from the individual performance obtained by a specific investor.
The Bloomberg Global Aggregate Index is a flagship measure of global investment grade debt from twenty-four local currency markets. This multi-currency benchmark includes treasury, government-related, corporate and securitized fixed-rate bonds from both developed and emerging markets issuers. An investor cannot invest directly in an index. The volatility of the benchmark may be materially different from the individual performance obtained by a specific investor.
The ICE Exchange-Listed Fixed & Adjustable Rate Preferred Securities Index is a modified market capitalization weighted index composed of preferred stock and securities that are functionally equivalent to preferred stock including, but not limited to, depositary preferred securities, perpetual subordinated debt and certain securities issued by banks and other financial institutions that are eligible for capital treatment with respect to such instruments akin to that received for issuance of straight preferred stock. An investor cannot invest directly in an index. The volatility of the benchmark may be materially different from the individual performance obtained by a specific investor.
The MSCI ACWI ex U.S. Index captures large and mid-cap representation across 22 of 23 Developed Markets (DM) countries (excluding the United States) and 24 Emerging Markets (EM) countries. The index covers approximately 85% of the global equity opportunity set outside the U.S. An investor cannot invest directly in an index. The volatility of the benchmark may be materially different from the individual performance obtained by a specific investor.
The Russell 2000 Index is a well-known, unmanaged index of the prices of 2000 small-cap company common stocks, selected by Russell. The Russell 2000 Index assumes reinvestment of dividends but does not reflect advisory fees. An investor cannot invest directly in an index. The volatility of the benchmark may be materially different from the individual performance obtained by a specific investor.
The S&P Mid Cap 400 provides investors with a benchmark for mid-sized companies. The index, which is distinct from the large-cap S&P 500, is designed to measure the performance of 400 mid-sized companies, reflecting the distinctive risk and return characteristics of this market segment.
The S&P 500 Pure Value index is a style-concentrated index designed to track the performance of stocks that exhibit the strongest value characteristics by using a style-attractiveness-weighting scheme. An investor cannot directly invest in an index. The volatility of the benchmark may be materially different from the individual performance obtained by a specific investor.