With Rising Yields, Should Investors Sell Stocks and Buy Bonds?
Most investors and readers are aware that interest rates have been on the rise for well over a year now. The yields on savings accounts, CDs, money market funds, and bonds have all gone up. In the risk-free category of U.S. Treasury bonds, the 10-year yield has gone from 1.63% at the beginning of 2022 to over 4% by August 2023.1
It would be reasonable to expect that such attractive yields in the fixed income markets would encourage investors to shift capital away from stocks and towards bonds. After all, the equity risk premium – which is calculated by subtracting the 10-year Treasury bond yield from the S&P 500’s forward earnings yield (E/P) – narrowed to just 70 basis points as of Friday, August 18. By this measure, 70 bps is not a very compelling level of compensation for the added risk of owning stocks versus bonds.
And yet, we have not been witnessing a dramatic rotation from stocks to bonds. In fact, stocks have largely gone up since last October.2
I’ll offer three reasons why.
The first is simply that rising rates mean falling bond prices. With stocks, experienced investors know that it’s often a good idea to buy stocks when they’re falling or when there’s ‘blood on the streets,’ because over time stocks follow the expected path of earnings and economic growth. Recessions and bear markets happen, of course, but throughout history, the economy grows more than it contracts, and corporations’ earnings expand and go up. Stocks don’t stay cheap for long, so it’s been wise historically to buy them when they are.
Bonds are different. When yields go up, the prices of bonds go down. For long duration Treasuries over the past year and a half or so, that’s meant a long stretch of weak/negative performance. It’s not necessarily in investors’ nature to buy more bonds as prices fall. Instead, investors usually think about whether interest rates may continue to go up or not. In the current environment, there’s not a good answer for where interest rates will settle, which I think is a key reason we’re not seeing a major rotation. The Fed’s inflation fight is ongoing, and the economy continues to perform better-than-expected (which justifies higher rates).
As a side note here, Zacks Investment Management actively manages our fixed income portfolio based on our forecasts for interest rates, inflation, and economic growth. We’ve tended to stay on the ‘short’ end of the duration curve for Treasuries because of interest rate risk, while favoring investment-grade corporates for our intermediate and long-duration bond holdings.
The second reason investors have not been dumping stocks to buy bonds is because for many, owning stocks versus bonds is not an either/or decision. In our view, having fixed income in a portfolio is not about making interest rate bets to generate excess returns from bond trading. It’s about establishing an asset allocation that meets an investor’s expectations for long-term, risk-adjusted returns. Unless an investor experiences significant changes to their financial situation, goals, and cash flow needs (which of course does happen), then it’s not likely that their asset allocation should undergo a major change just based on recent performance.
The final reason has to do with the myth that higher interest rates are automatically bad for stocks and the economy. While there’s good logic behind why higher interest rates would crimp growth and profitability, history shows that the U.S. economy and stocks have withstood higher rates on numerous occasions, posting solid growth and performance, respectively, even when rates were much higher than they are today.
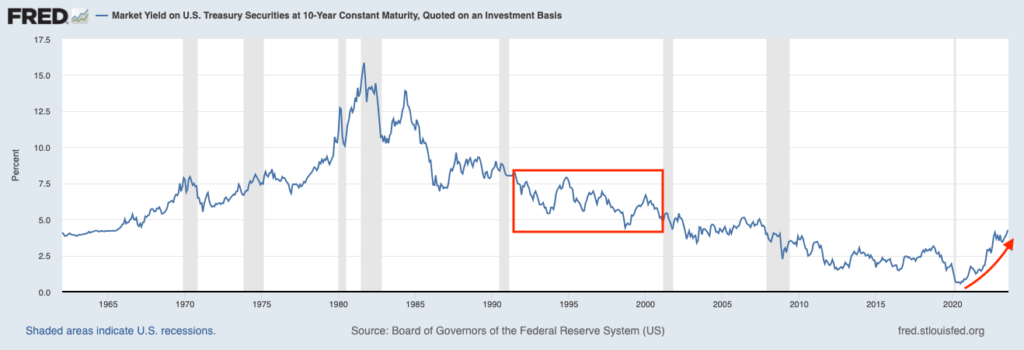
In the chart below, the red box highlights the 10-year U.S. Treasury bond yield during the 1990s, which readers can see marks a period when interest rates were higher than they are today. That was also one of the best times for economic growth, and a great time to be invested.
Yield on 10-Year U.S. Treasury Bond
Bottom Line for Investors
I do not want to dismiss the significance of such a narrow equity risk premium, especially when we compare it to what it was just a couple of years ago. In that time, bonds have become more attractive relative to stocks, as yields have gone up, stock multiples have also gone up, and corporate earnings have experienced a weak patch.
But to also suggest that stocks have limited upside potential in the near- to medium-term because interest rates are high and rising does not comport with what we know about stock performance historically. Earnings could very well surprise to the upside, which means stocks could, too. As for bonds, higher yields also imply higher expected returns in the future, which isn’t bad news at all. It just may mean more volatility in the near term.
Disclosure
2 Wall Street Journal. August 16, 2023. https://www.wsj.com/finance/investing/investors-need-to-worry-about-the-bond-markets-return-to-normality-843549b7
DISCLOSURE
Past performance is no guarantee of future results. Inherent in any investment is the potential for loss.
Zacks Investment Management, Inc. is a wholly-owned subsidiary of Zacks Investment Research. Zacks Investment Management is an independent Registered Investment Advisory firm and acts as an investment manager for individuals and institutions. Zacks Investment Research is a provider of earnings data and other financial data to institutions and to individuals.
This material is being provided for informational purposes only and nothing herein constitutes investment, legal, accounting or tax advice, or a recommendation to buy, sell or hold a security. Do not act or rely upon the information and advice given in this publication without seeking the services of competent and professional legal, tax, or accounting counsel. Publication and distribution of this article is not intended to create, and the information contained herein does not constitute, an attorney-client relationship. No recommendation or advice is being given as to whether any investment or strategy is suitable for a particular investor. It should not be assumed that any investments in securities, companies, sectors or markets identified and described were or will be profitable. All information is current as of the date of herein and is subject to change without notice. Any views or opinions expressed may not reflect those of the firm as a whole.
Any projections, targets, or estimates in this report are forward looking statements and are based on the firm’s research, analysis, and assumptions. Due to rapidly changing market conditions and the complexity of investment decisions, supplemental information and other sources may be required to make informed investment decisions based on your individual investment objectives and suitability specifications. All expressions of opinions are subject to change without notice. Clients should seek financial advice regarding the appropriateness of investing in any security or investment strategy discussed in this presentation.
Certain economic and market information contained herein has been obtained from published sources prepared by other parties. Zacks Investment Management does not assume any responsibility for the accuracy or completeness of such information. Further, no third party has assumed responsibility for independently verifying the information contained herein and accordingly no such persons make any representations with respect to the accuracy, completeness or reasonableness of the information provided herein. Unless otherwise indicated, market analysis and conclusions are based upon opinions or assumptions that Zacks Investment Management considers to be reasonable. Any investment inherently involves a high degree of risk, beyond any specific risks discussed herein.
The S&P 500 Index is a well-known, unmanaged index of the prices of 500 large-company common stocks, mainly blue-chip stocks, selected by Standard & Poor’s. The S&P 500 Index assumes reinvestment of dividends but does not reflect advisory fees. The volatility of the benchmark may be materially different from the individual performance obtained by a specific investor. An investor cannot invest directly in an index.
The Russell 1000 Growth Index is a well-known, unmanaged index of the prices of 1000 large-company growth common stocks selected by Russell. The Russell 1000 Growth Index assumes reinvestment of dividends but does not reflect advisory fees. An investor cannot invest directly in an index. The volatility of the benchmark may be materially different from the individual performance obtained by a specific investor.
Nasdaq Composite Index is the market capitalization-weighted index of over 3,300 common equities listed on the Nasdaq stock exchange. The types of securities in the index include American depositary receipts, common stocks, real estate investment trusts (REITs) and tracking stocks, as well as limited partnership interests. The index includes all Nasdaq-listed stocks that are not derivatives, preferred shares, funds, exchange-traded funds (ETFs) or debenture securities. An investor cannot invest directly in an index. The volatility of the benchmark may be materially different from the individual performance obtained by a specific investor.
The Dow Jones Industrial Average measures the daily stock market movements of 30 U.S. publicly-traded companies listed on the NASDAQ or the New York Stock Exchange (NYSE). The 30 publicly-owned companies are considered leaders in the United States economy. An investor cannot directly invest in an index. The volatility of the benchmark may be materially different from the individual performance obtained by a specific investor.
The Bloomberg Global Aggregate Index is a flagship measure of global investment grade debt from twenty-four local currency markets. This multi-currency benchmark includes treasury, government-related, corporate and securitized fixed-rate bonds from both developed and emerging markets issuers. An investor cannot invest directly in an index. The volatility of the benchmark may be materially different from the individual performance obtained by a specific investor.
The ICE Exchange-Listed Fixed & Adjustable Rate Preferred Securities Index is a modified market capitalization weighted index composed of preferred stock and securities that are functionally equivalent to preferred stock including, but not limited to, depositary preferred securities, perpetual subordinated debt and certain securities issued by banks and other financial institutions that are eligible for capital treatment with respect to such instruments akin to that received for issuance of straight preferred stock. An investor cannot invest directly in an index. The volatility of the benchmark may be materially different from the individual performance obtained by a specific investor.
The MSCI ACWI ex U.S. Index captures large and mid-cap representation across 22 of 23 Developed Markets (DM) countries (excluding the United States) and 24 Emerging Markets (EM) countries. The index covers approximately 85% of the global equity opportunity set outside the U.S. An investor cannot invest directly in an index. The volatility of the benchmark may be materially different from the individual performance obtained by a specific investor.
The Russell 2000 Index is a well-known, unmanaged index of the prices of 2000 small-cap company common stocks, selected by Russell. The Russell 2000 Index assumes reinvestment of dividends but does not reflect advisory fees. An investor cannot invest directly in an index. The volatility of the benchmark may be materially different from the individual performance obtained by a specific investor.
The S&P Mid Cap 400 provides investors with a benchmark for mid-sized companies. The index, which is distinct from the large-cap S&P 500, is designed to measure the performance of 400 mid-sized companies, reflecting the distinctive risk and return characteristics of this market segment.
The S&P 500 Pure Value index is a style-concentrated index designed to track the performance of stocks that exhibit the strongest value characteristics by using a style-attractiveness-weighting scheme. An investor cannot directly invest in an index. The volatility of the benchmark may be materially different from the individual performance obtained by a specific investor.