The last few years offer a case study of how quickly energy markets can shift.
In 2020, the pandemic and ensuing shutdowns and restrictions saw oil demand plummet, sending prices into negative territory for a brief period. Margins for oil producers fell to multi-decade lows, and S&P 500 energy stocks fell by a third that year as earnings plummeted.1
Prices rebounded in 2021, however, and then shifted into overdrive in 2022 due to supply constraints tied to the war in Ukraine, which sent the price of a barrel of crude oil above $100 a barrel. S&P 500 Energy stocks rebounded +54.6% in 2021 and are up +34.9% in the first three quarters of 2022.
_________________________________________________________________________
Get Insight into Key Data Points
As quickly as energy markets can shift – so can your investments. For all investors, I recommend keeping an eye on important factors that can protect your investments through market changes.
To help you do this, I am offering all readers a look into our just-released November 2022 Stock Market Outlook report.
This report will provide you with our forecasts along with additional factors to consider:
- Exclusive commentary on the future of the global economy
- When is it time to buy certain stocks?
- Zacks forecasts at a glance
- Zacks ranks S&P500 sector picks
- And more…
If you have $500,000 or more to invest and want to learn more about these forecasts, click on the link below to get your free report today!
IT’S FREE. Download the Just-Released November 2022 Stock Market Outlook2
_________________________________________________________________________
Natural gas prices have endured even more wild swings than oil. In April and May alone, prices soared over +60%, but then plummeted in June to finish the three months down -3.9%. Prices rebounded quickly over the summer, but as I write, natural gas prices have fallen again – down over -40% since late August3:
Natural Gas Prices (Dollars per Million BTUs)
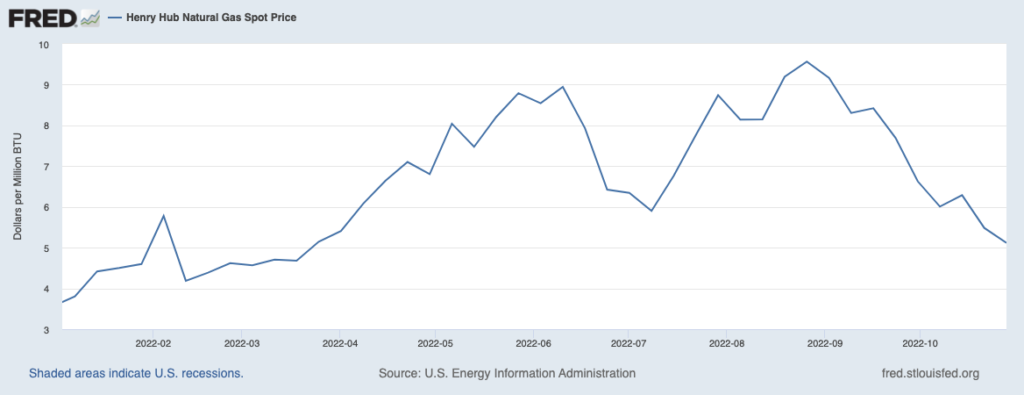
Source: Federal Reserve Bank of St. Louis4
Along the way, investors have likely heard all manner of predictions and forecasts for where oil, natural gas, and other commodity prices are headed. Most of them have painted a dire picture for energy markets, one in which oil could rise above $200 a barrel and/or where many Americans would struggle to pay heating bills this winter.
Most of these predictions have been, and continue to be, wrong.
Though not widely reported, overall U.S. oil production is currently closing in on all-time highs. In August, U.S. oil output rose to 12 million barrels per day, which is just one million barrels a day shy of a record. Natural gas prices have also moved in unexpected ways. Warmer-than-expected weather in September meant less gas was consumed for air conditioning, which happened at the same time as record domestic production (100 billion cubic feet a day) in the U.S. The result has been gas-storage facilities filling up quickly ahead of winter.
Most warnings dealing with energy have said that a crisis is looming, but markets have been moving in the opposite direction. Oil and gas supplies have been growing, not dwindling.
For investors, rapid shifts in the energy markets should be expected, but they should not mean rapid shifts in your portfolio positioning. Since earnings for oil and gas companies are impacted by price more than anything else, and since we know prices can be wildly volatile and largely unpredictable, I think it’s wise not to have Energy exposure too much higher or too much lower than your benchmark. There is simply too much risk that prices will move in a direction that runs counter to your wager.
Bottom Line for Investors
The Energy sector’s earnings are on track to grow +142.6% this year, which makes the sector responsible for the S&P 500 earnings growth we’ve seen in 2022 year-to-date. In Q3 2022, total S&P 500 earnings are currently expected to be up +2.0% from the same period last year on +10.7% higher revenues. But excluding contributions from the Energy sector, Q3 earnings for the rest of the index would be -5.6% below the year-earlier level.
A rational investor might wonder: if the Energy sector is the only area of the market generating positive earnings growth – and huge positive earnings growth at that – then why not substantially increase portfolio exposure to the sector while the earnings outperformance persists? The reason is that we cannot assume oil and gas prices are going to remain stable or rise going forward from here. Current trends indicate the opposite – elevated prices incentivize more production, as we’re seeing now with near-record oil and gas production in the U.S. Bringing on more supply is good from a consumption and manufacturing standpoint, but it also moves global supply and demands back into balance – which could ultimately pressure prices lower. Being heavily overweight to Energy when oil and gas prices are falling is not where an investor wants to be.
To help you figure out a strategy that works best for your investments in the meantime, I recommend looking at key forecasts and data to guide your investing decisions. Our Just-Released Stock Market Outlook Report can help you do just that.
In this report, you will learn:
- Exclusive commentary on the future of the global economy
- When is it time to buy certain stocks?
- Zacks forecasts at a glance
- Zacks ranks S&P500 sector picks
- And more…
If you have $500,000 or more to invest and want to learn more about these forecasts, click on the link below to get your free report today!
Disclosure
2 Zacks Investment Management reserves the right to amend the terms or rescind the free-Stock Market Outlook Report offer at any time and for any reason at its discretion.
3 Wall Street Journal. October 30, 2022. https://www.wsj.com/articles/natural-gas-prices-have-plunged-into-autumn-11667084564
4 Fred Economic Data. November 2, 2022. https://fred.stlouisfed.org/series/DHHNGSP#
5 Zacks Investment Management reserves the right to amend the terms or rescind the free-Stock Market Outlook Report offer at any time and for any reason at its discretion.
DISCLOSURE
Past performance is no guarantee of future results. Inherent in any investment is the potential for loss.
Zacks Investment Management, Inc. is a wholly-owned subsidiary of Zacks Investment Research. Zacks Investment Management is an independent Registered Investment Advisory firm and acts as an investment manager for individuals and institutions. Zacks Investment Research is a provider of earnings data and other financial data to institutions and to individuals.
This material is being provided for informational purposes only and nothing herein constitutes investment, legal, accounting or tax advice, or a recommendation to buy, sell or hold a security. Do not act or rely upon the information and advice given in this publication without seeking the services of competent and professional legal, tax, or accounting counsel. Publication and distribution of this article is not intended to create, and the information contained herein does not constitute, an attorney-client relationship. No recommendation or advice is being given as to whether any investment or strategy is suitable for a particular investor. It should not be assumed that any investments in securities, companies, sectors or markets identified and described were or will be profitable. All information is current as of the date of herein and is subject to change without notice. Any views or opinions expressed may not reflect those of the firm as a whole.
Any projections, targets, or estimates in this report are forward looking statements and are based on the firm’s research, analysis, and assumptions. Due to rapidly changing market conditions and the complexity of investment decisions, supplemental information and other sources may be required to make informed investment decisions based on your individual investment objectives and suitability specifications. All expressions of opinions are subject to change without notice. Clients should seek financial advice regarding the appropriateness of investing in any security or investment strategy discussed in this presentation.
Certain economic and market information contained herein has been obtained from published sources prepared by other parties. Zacks Investment Management does not assume any responsibility for the accuracy or completeness of such information. Further, no third party has assumed responsibility for independently verifying the information contained herein and accordingly no such persons make any representations with respect to the accuracy, completeness or reasonableness of the information provided herein. Unless otherwise indicated, market analysis and conclusions are based upon opinions or assumptions that Zacks Investment Management considers to be reasonable. Any investment inherently involves a high degree of risk, beyond any specific risks discussed herein.
The S&P 500 Index is a well-known, unmanaged index of the prices of 500 large-company common stocks, mainly blue-chip stocks, selected by Standard & Poor’s. The S&P 500 Index assumes reinvestment of dividends but does not reflect advisory fees. The volatility of the benchmark may be materially different from the individual performance obtained by a specific investor. An investor cannot invest directly in an index.
The Russell 1000 Growth Index is a well-known, unmanaged index of the prices of 1000 large-company growth common stocks selected by Russell. The Russell 1000 Growth Index assumes reinvestment of dividends but does not reflect advisory fees. An investor cannot invest directly in an index. The volatility of the benchmark may be materially different from the individual performance obtained by a specific investor.
Nasdaq Composite Index is the market capitalization-weighted index of over 3,300 common equities listed on the Nasdaq stock exchange. The types of securities in the index include American depositary receipts, common stocks, real estate investment trusts (REITs) and tracking stocks, as well as limited partnership interests. The index includes all Nasdaq-listed stocks that are not derivatives, preferred shares, funds, exchange-traded funds (ETFs) or debenture securities. An investor cannot invest directly in an index. The volatility of the benchmark may be materially different from the individual performance obtained by a specific investor.
The Dow Jones Industrial Average measures the daily stock market movements of 30 U.S. publicly-traded companies listed on the NASDAQ or the New York Stock Exchange (NYSE). The 30 publicly-owned companies are considered leaders in the United States economy. An investor cannot directly invest in an index. The volatility of the benchmark may be materially different from the individual performance obtained by a specific investor.
The Bloomberg Global Aggregate Index is a flagship measure of global investment grade debt from twenty-four local currency markets. This multi-currency benchmark includes treasury, government-related, corporate and securitized fixed-rate bonds from both developed and emerging markets issuers. An investor cannot invest directly in an index. The volatility of the benchmark may be materially different from the individual performance obtained by a specific investor.
The ICE Exchange-Listed Fixed & Adjustable Rate Preferred Securities Index is a modified market capitalization weighted index composed of preferred stock and securities that are functionally equivalent to preferred stock including, but not limited to, depositary preferred securities, perpetual subordinated debt and certain securities issued by banks and other financial institutions that are eligible for capital treatment with respect to such instruments akin to that received for issuance of straight preferred stock. An investor cannot invest directly in an index. The volatility of the benchmark may be materially different from the individual performance obtained by a specific investor.