How U.S. Companies are Responding to Higher Interest Rates
Basic economic thinking tells us that when interest rates rise, individuals and corporations will borrow less. Higher rates mean higher interest payments, and they also cut into expected returns from borrowed capital. Given interest rates have been climbing steadily since early 2022, one might reasonably expect that corporations have substantially pared back borrowing (via bond issuance) over the past year or so.
They haven’t.
During the week of September 4 – which is typically a busy week for borrowing as Wall Street returns from summer vacation – investment-grade corporations issued bonds at a record pace. On September 5 alone, 19 companies sold 47 bond tranches in the U.S., the highest number recorded since 2012. Bond sales totaled nearly $38 billion on that day, which was the largest amount of corporate bonds sold since April 2020, when interest rates were effectively 0%.1
High levels of bond sales come at a time when investment-grade corporations are paying an average yield of 5.7%, for companies refinancing is about 2% higher than the bond they’re replacing (on average). As readers can see in the chart below, that’s the steepest yield in over a decade. High quality firms have not paid this much to borrow since the Global Financial Crisis.
Corporate Bond Yields (Moody’s AAA-Rated)
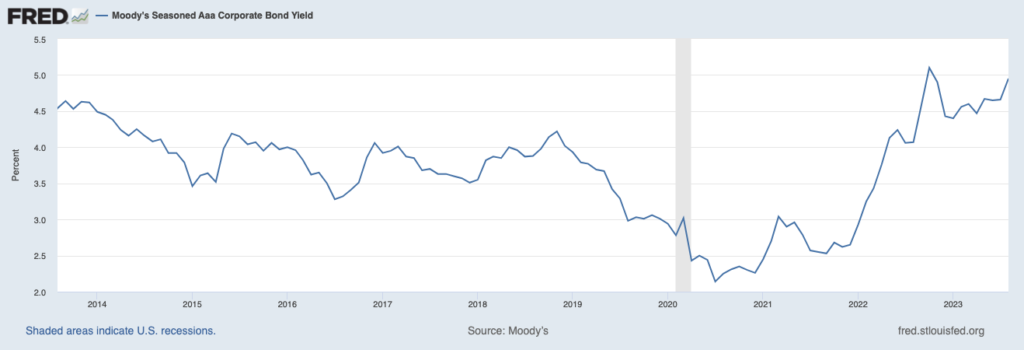
It’s clear from issuance, however, that corporations are still choosing to borrow. There may be a couple of reasons why.
First, some corporations may feel some uncertainty over where interest rates are heading from here. The Federal Reserve continues to express caution about the inflation fight, and the U.S. economy has been delivering better-than-expected growth to date. The idea that interest rates could tick even higher from here – and stay there for a period of time – has some companies betting that now is a better time to borrow than three or six months from now.
But a second, more compelling reason for high levels of borrowing, in my view, is that corporations have optimistic outlooks about both economic and earnings growth – and they want to invest.
On one hand, fiscal incentives to invest are high at the moment. Government programs like the 2022 Inflation Reduction Act, the Infrastructure Investment and Jobs Act, and the 2022 CHIPS Act in total will deliver about $2.4 trillion in new spending, which has already resulted in hundreds of billions of new investments in areas like semiconductor chip factories. A look from the Q2 earnings season found that over 60% of S&P 500 companies increased investment over the past year. As seen in the chart below of private nonresidential fixed investment, year-over-year growth has averaged about 10% – even as interest rates have climbed over the same stretch.
Business Investment (Year-Over-Year % Change)
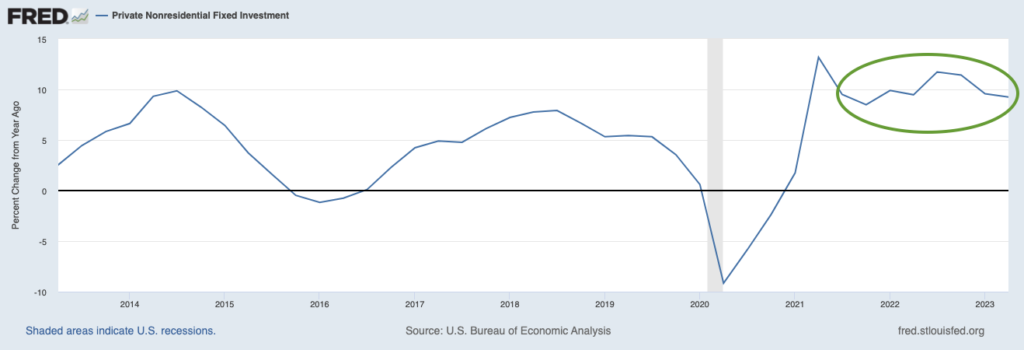
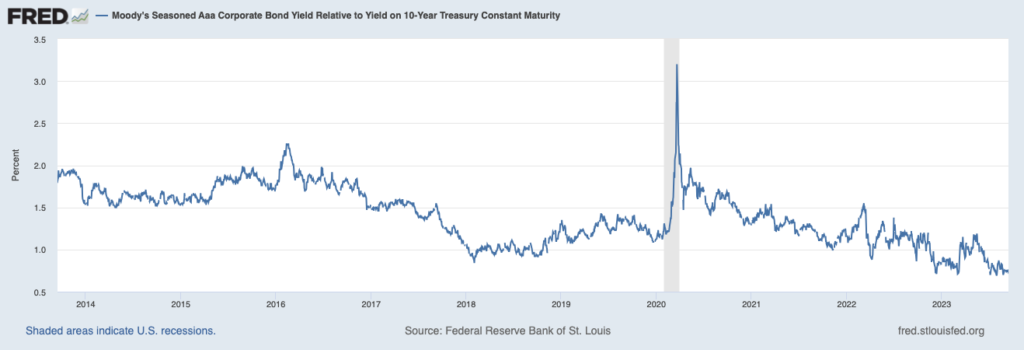
Corporations are paying more to borrow, but it’s also true that spreads (the difference between yields on investment grade bonds and 10-year U.S. Treasury bonds) have narrowed over the past few months. I think this narrowing spread is largely a result of an improving economic outlook, combined with strong corporate balance sheets.
Bottom Line for Investors
I’m not making the argument that higher interest rates are meaningless to individuals or businesses when making decisions about borrowing and investing. However, the data above suggests that the relationship between interest rates and investment/economic activity is not quite as linear as is often suggested. Sometimes higher rates put a major dent on investment and borrowing, thus hurting economic activity and resulting in recession. But sometimes they don’t. The overall stability of the U.S. housing market, in the face of higher mortgage rates, underscores this point as well.
There are also areas of the market where higher rates do make a big impact, such as with less creditworthy corporate borrowers or those with high debt loads relative to earnings. For these companies, higher rates are much more of a major issue, and default risk is likely to keep going up. From a fixed income investor standpoint, these would be bond issues to avoid.
Disclosure
2 Fred Economic Data. September 5, 2023. https://fred.stlouisfed.org/series/AAA#
3 Fred Economic Data. August 30, 2023. https://fred.stlouisfed.org/series/PNFI
4 Fred Economic Data. September 15, 2023. https://fred.stlouisfed.org/series/AAA10Y#
DISCLOSURE
Past performance is no guarantee of future results. Inherent in any investment is the potential for loss.
Zacks Investment Management, Inc. is a wholly-owned subsidiary of Zacks Investment Research. Zacks Investment Management is an independent Registered Investment Advisory firm and acts as an investment manager for individuals and institutions. Zacks Investment Research is a provider of earnings data and other financial data to institutions and to individuals.
This material is being provided for informational purposes only and nothing herein constitutes investment, legal, accounting or tax advice, or a recommendation to buy, sell or hold a security. Do not act or rely upon the information and advice given in this publication without seeking the services of competent and professional legal, tax, or accounting counsel. Publication and distribution of this article is not intended to create, and the information contained herein does not constitute, an attorney-client relationship. No recommendation or advice is being given as to whether any investment or strategy is suitable for a particular investor. It should not be assumed that any investments in securities, companies, sectors or markets identified and described were or will be profitable. All information is current as of the date of herein and is subject to change without notice. Any views or opinions expressed may not reflect those of the firm as a whole.
Any projections, targets, or estimates in this report are forward looking statements and are based on the firm’s research, analysis, and assumptions. Due to rapidly changing market conditions and the complexity of investment decisions, supplemental information and other sources may be required to make informed investment decisions based on your individual investment objectives and suitability specifications. All expressions of opinions are subject to change without notice. Clients should seek financial advice regarding the appropriateness of investing in any security or investment strategy discussed in this presentation.
Certain economic and market information contained herein has been obtained from published sources prepared by other parties. Zacks Investment Management does not assume any responsibility for the accuracy or completeness of such information. Further, no third party has assumed responsibility for independently verifying the information contained herein and accordingly no such persons make any representations with respect to the accuracy, completeness or reasonableness of the information provided herein. Unless otherwise indicated, market analysis and conclusions are based upon opinions or assumptions that Zacks Investment Management considers to be reasonable. Any investment inherently involves a high degree of risk, beyond any specific risks discussed herein.
The S&P 500 Index is a well-known, unmanaged index of the prices of 500 large-company common stocks, mainly blue-chip stocks, selected by Standard & Poor’s. The S&P 500 Index assumes reinvestment of dividends but does not reflect advisory fees. The volatility of the benchmark may be materially different from the individual performance obtained by a specific investor. An investor cannot invest directly in an index.
The Russell 1000 Growth Index is a well-known, unmanaged index of the prices of 1000 large-company growth common stocks selected by Russell. The Russell 1000 Growth Index assumes reinvestment of dividends but does not reflect advisory fees. An investor cannot invest directly in an index. The volatility of the benchmark may be materially different from the individual performance obtained by a specific investor.
Nasdaq Composite Index is the market capitalization-weighted index of over 3,300 common equities listed on the Nasdaq stock exchange. The types of securities in the index include American depositary receipts, common stocks, real estate investment trusts (REITs) and tracking stocks, as well as limited partnership interests. The index includes all Nasdaq-listed stocks that are not derivatives, preferred shares, funds, exchange-traded funds (ETFs) or debenture securities. An investor cannot invest directly in an index. The volatility of the benchmark may be materially different from the individual performance obtained by a specific investor.
The Dow Jones Industrial Average measures the daily stock market movements of 30 U.S. publicly-traded companies listed on the NASDAQ or the New York Stock Exchange (NYSE). The 30 publicly-owned companies are considered leaders in the United States economy. An investor cannot directly invest in an index. The volatility of the benchmark may be materially different from the individual performance obtained by a specific investor.
The Bloomberg Global Aggregate Index is a flagship measure of global investment grade debt from twenty-four local currency markets. This multi-currency benchmark includes treasury, government-related, corporate and securitized fixed-rate bonds from both developed and emerging markets issuers. An investor cannot invest directly in an index. The volatility of the benchmark may be materially different from the individual performance obtained by a specific investor.
The ICE Exchange-Listed Fixed & Adjustable Rate Preferred Securities Index is a modified market capitalization weighted index composed of preferred stock and securities that are functionally equivalent to preferred stock including, but not limited to, depositary preferred securities, perpetual subordinated debt and certain securities issued by banks and other financial institutions that are eligible for capital treatment with respect to such instruments akin to that received for issuance of straight preferred stock. An investor cannot invest directly in an index. The volatility of the benchmark may be materially different from the individual performance obtained by a specific investor.
The MSCI ACWI ex U.S. Index captures large and mid-cap representation across 22 of 23 Developed Markets (DM) countries (excluding the United States) and 24 Emerging Markets (EM) countries. The index covers approximately 85% of the global equity opportunity set outside the U.S. An investor cannot invest directly in an index. The volatility of the benchmark may be materially different from the individual performance obtained by a specific investor.
The Russell 2000 Index is a well-known, unmanaged index of the prices of 2000 small-cap company common stocks, selected by Russell. The Russell 2000 Index assumes reinvestment of dividends but does not reflect advisory fees. An investor cannot invest directly in an index. The volatility of the benchmark may be materially different from the individual performance obtained by a specific investor.
The S&P Mid Cap 400 provides investors with a benchmark for mid-sized companies. The index, which is distinct from the large-cap S&P 500, is designed to measure the performance of 400 mid-sized companies, reflecting the distinctive risk and return characteristics of this market segment.
The S&P 500 Pure Value index is a style-concentrated index designed to track the performance of stocks that exhibit the strongest value characteristics by using a style-attractiveness-weighting scheme. An investor cannot directly invest in an index. The volatility of the benchmark may be materially different from the individual performance obtained by a specific investor.