The Economic Threat of Higher Oil Prices
The global price of a barrel of crude oil has been climbing over the last several weeks, rising over 20% since early July. That’s good news for oil producers and refiners, but not necessarily for everyone else.1
Oil prices have risen sharply over the past several weeks
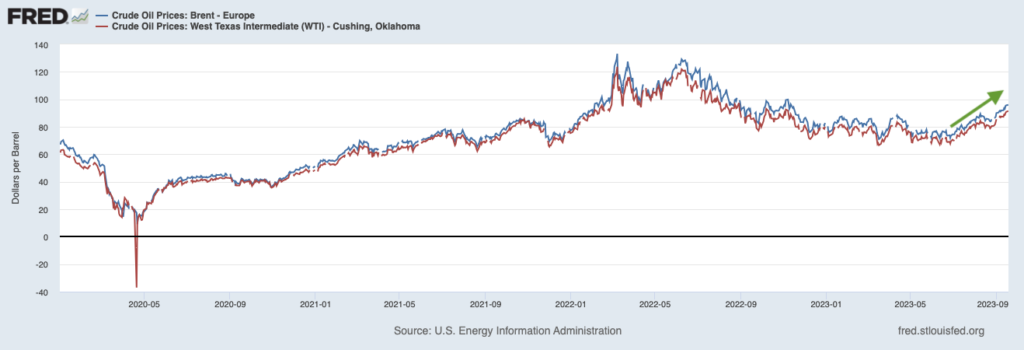
Most readers know the obvious drawbacks to higher oil prices, like higher gas prices. But more expensive oil can also drive up the price of food and other goods. If freight haulers are paying more to move goods around the country, the prices of those goods can also go up as companies account for rising input costs. Oil is also used in the production of everything from plastics to fertilizers, impacting the cost of food and other goods and services that exist downstream.
People that are worried about higher oil prices point to a few factors. Higher prices at the pump can dent consumer spending since households spending more on gas have less to spend on other discretionary purchases. Another concern is that higher oil prices are inflationary, which means the Federal Reserve may have no choice but to continue raising rates, in effect tightening monetary policy more than the market is currently expecting. They may also need to leave rates higher for longer.
These are all valid concerns, especially considering the Fed’s decision to pause rate increases at their meeting last week. The Fed set the expectation that more rate increases may be needed, but the market is largely anticipating that the rate hike campaign is drawing to a close. Higher oil prices could complicate this view.
For investors trying to gauge whether higher oil prices pose a meaningful threat to economic growth and market performance, it’s important to give the issue some context.
First is to consider why oil prices have been rising so quickly of late. Supply is playing a key role — Saudi Arabia and Russia announced recently that the production cuts (of a combined 1.3 million barrels a day) scheduled to end in September would be extended to the end of the year. Elsewhere, OPEC+ members have routinely fallen short of production quotas because of the lack of infrastructure, worker strikes (Nigeria), and other bottlenecks.
The demand side of the equation is much less worrisome. The U.S. economy has been growing at a stronger-than-expected clip, which has meant demand for oil has been surprising to the upside. Many economists worry that China’s real estate and consumer-sector woes would dent global demand, but those concerns appear to be slightly overblown (at least for now). According to the International Energy Agency, oil demand reached a record in June, and is expected to reach its highest annual level ever by year-end. A global economy that’s stronger-than-expected is generally not a negative for markets.
There are other reasons not to get too bearish on higher oil. For one, the economy and markets have withstood $100+ in oil before. The chart below shows the global price of Brent Crude and West Texas Intermediate oil, going back to 2000. I’ve circled in green a period of about 4 years when oil prices hovered in the $100 a barrel range, which were also years when the economy grew consistently – albeit modestly – and stocks remained locked in a bull market.
The U.S. economy can withstand higher oil prices
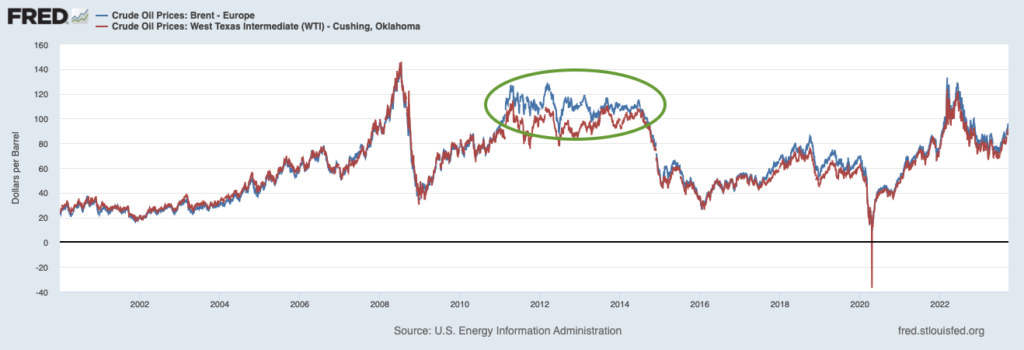
Another reason is that higher oil prices tend to stimulate additional production, as producers are incentivized to bring more supply into the market. Non-OPEC+ oil producers, like the U.S., Canada, and Brazil, respond to market forces – not production quotas – when deciding how much to produce. The U.S. is the world’s largest oil producer, and our country is poised to hit an all-time high in oil production this year, at 12.8 million barrels per day. Canada and Brazil are also pushing production higher, with both countries producing at or near all-time highs.
A final point to make regards the U.S. consumer. No one likes higher gas prices, to be crystal clear. But it’s also true that the average American spends about $150 to $200 a month on gas, with the average American family spending about $5,000 per year. As a percentage of U.S. household monthly income, spending on gas for a dual-income family is usually less than 5% on average. As long as the labor market remains strong and wages keep ticking higher, I’d argue that an incremental increase to monthly spending on gas won’t move the needle too much on overall spending.
Bottom Line for Investors
There’s no argument that higher oil prices are good for the U.S. and the global economy. They’re not. But the flip side of the argument doesn’t work either, where $100 oil is framed as a negative too great for the economy and U.S. consumers to overcome. The reality is that the U.S. economy can withstand higher oil prices – it has many times before – and the Federal Reserve is likely to continue focusing on “core” prices, which exclude the volatile food and energy categories. And while it’s true that households loathe higher prices at the pump, paying more for gas each month may not do much to crimp overall spending, as long as the labor market remains tight.
Disclosure
2 Fred Economic Data. September 20, 2023. https://fred.stlouisfed.org/series/DCOILBRENTEU#
3 Fred Economic Data. September 20, 2023. https://fred.stlouisfed.org/series/DCOILBRENTEU#
DISCLOSURE
Past performance is no guarantee of future results. Inherent in any investment is the potential for loss.
Zacks Investment Management, Inc. is a wholly-owned subsidiary of Zacks Investment Research. Zacks Investment Management is an independent Registered Investment Advisory firm and acts as an investment manager for individuals and institutions. Zacks Investment Research is a provider of earnings data and other financial data to institutions and to individuals.
This material is being provided for informational purposes only and nothing herein constitutes investment, legal, accounting or tax advice, or a recommendation to buy, sell or hold a security. Do not act or rely upon the information and advice given in this publication without seeking the services of competent and professional legal, tax, or accounting counsel. Publication and distribution of this article is not intended to create, and the information contained herein does not constitute, an attorney-client relationship. No recommendation or advice is being given as to whether any investment or strategy is suitable for a particular investor. It should not be assumed that any investments in securities, companies, sectors or markets identified and described were or will be profitable. All information is current as of the date of herein and is subject to change without notice. Any views or opinions expressed may not reflect those of the firm as a whole.
Any projections, targets, or estimates in this report are forward looking statements and are based on the firm’s research, analysis, and assumptions. Due to rapidly changing market conditions and the complexity of investment decisions, supplemental information and other sources may be required to make informed investment decisions based on your individual investment objectives and suitability specifications. All expressions of opinions are subject to change without notice. Clients should seek financial advice regarding the appropriateness of investing in any security or investment strategy discussed in this presentation.
Certain economic and market information contained herein has been obtained from published sources prepared by other parties. Zacks Investment Management does not assume any responsibility for the accuracy or completeness of such information. Further, no third party has assumed responsibility for independently verifying the information contained herein and accordingly no such persons make any representations with respect to the accuracy, completeness or reasonableness of the information provided herein. Unless otherwise indicated, market analysis and conclusions are based upon opinions or assumptions that Zacks Investment Management considers to be reasonable. Any investment inherently involves a high degree of risk, beyond any specific risks discussed herein.
The S&P 500 Index is a well-known, unmanaged index of the prices of 500 large-company common stocks, mainly blue-chip stocks, selected by Standard & Poor’s. The S&P 500 Index assumes reinvestment of dividends but does not reflect advisory fees. The volatility of the benchmark may be materially different from the individual performance obtained by a specific investor. An investor cannot invest directly in an index.
The Russell 1000 Growth Index is a well-known, unmanaged index of the prices of 1000 large-company growth common stocks selected by Russell. The Russell 1000 Growth Index assumes reinvestment of dividends but does not reflect advisory fees. An investor cannot invest directly in an index. The volatility of the benchmark may be materially different from the individual performance obtained by a specific investor.
Nasdaq Composite Index is the market capitalization-weighted index of over 3,300 common equities listed on the Nasdaq stock exchange. The types of securities in the index include American depositary receipts, common stocks, real estate investment trusts (REITs) and tracking stocks, as well as limited partnership interests. The index includes all Nasdaq-listed stocks that are not derivatives, preferred shares, funds, exchange-traded funds (ETFs) or debenture securities. An investor cannot invest directly in an index. The volatility of the benchmark may be materially different from the individual performance obtained by a specific investor.
The Dow Jones Industrial Average measures the daily stock market movements of 30 U.S. publicly-traded companies listed on the NASDAQ or the New York Stock Exchange (NYSE). The 30 publicly-owned companies are considered leaders in the United States economy. An investor cannot directly invest in an index. The volatility of the benchmark may be materially different from the individual performance obtained by a specific investor.
The Bloomberg Global Aggregate Index is a flagship measure of global investment grade debt from twenty-four local currency markets. This multi-currency benchmark includes treasury, government-related, corporate and securitized fixed-rate bonds from both developed and emerging markets issuers. An investor cannot invest directly in an index. The volatility of the benchmark may be materially different from the individual performance obtained by a specific investor.
The ICE Exchange-Listed Fixed & Adjustable Rate Preferred Securities Index is a modified market capitalization weighted index composed of preferred stock and securities that are functionally equivalent to preferred stock including, but not limited to, depositary preferred securities, perpetual subordinated debt and certain securities issued by banks and other financial institutions that are eligible for capital treatment with respect to such instruments akin to that received for issuance of straight preferred stock. An investor cannot invest directly in an index. The volatility of the benchmark may be materially different from the individual performance obtained by a specific investor.
The MSCI ACWI ex U.S. Index captures large and mid-cap representation across 22 of 23 Developed Markets (DM) countries (excluding the United States) and 24 Emerging Markets (EM) countries. The index covers approximately 85% of the global equity opportunity set outside the U.S. An investor cannot invest directly in an index. The volatility of the benchmark may be materially different from the individual performance obtained by a specific investor.
The Russell 2000 Index is a well-known, unmanaged index of the prices of 2000 small-cap company common stocks, selected by Russell. The Russell 2000 Index assumes reinvestment of dividends but does not reflect advisory fees. An investor cannot invest directly in an index. The volatility of the benchmark may be materially different from the individual performance obtained by a specific investor.
The S&P Mid Cap 400 provides investors with a benchmark for mid-sized companies. The index, which is distinct from the large-cap S&P 500, is designed to measure the performance of 400 mid-sized companies, reflecting the distinctive risk and return characteristics of this market segment.
The S&P 500 Pure Value index is a style-concentrated index designed to track the performance of stocks that exhibit the strongest value characteristics by using a style-attractiveness-weighting scheme. An investor cannot directly invest in an index. The volatility of the benchmark may be materially different from the individual performance obtained by a specific investor.