Earnings season is underway, and some high-profile misses in the retail sector arguably drove a fresh wave of volatility in the stock market. According to our colleagues at Zacks Investment Research1, multiple factors were at play in these earnings misses: merchandising missteps, failing to read evolving consumer behavior, and a failure to fully factor the effect of rising costs. In other words, it’s not necessarily the consumer that had a weak Q1 – just the companies serving them.
Indeed, in a survey conducted last fall by the Federal Reserve, Americans reported the highest level of financial well-being in 10 years, boosted by a strong jobs market with rising wages. Higher inflation and particularly rising food and gas prices likely dented this position in Q1 2022, but not so much that consumers are all of a sudden financially vulnerable. JP Morgan Chase reported last week that they expect credit losses to remain uncharacteristically low through 2023, and they are reporting strong cash balances among bank customers.2
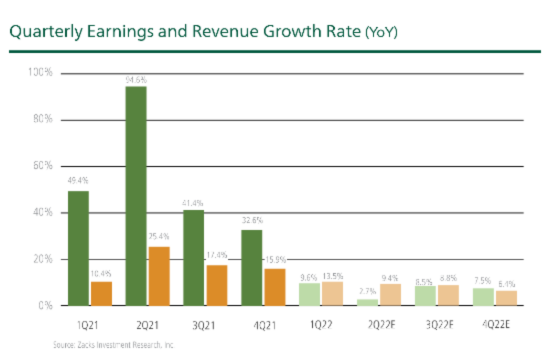
Zooming out and looking at the Q1 earnings season as a whole, the total S&P 500 earnings are expected to be up +9.6% on +13.5% higher revenues. Companies are dealing with a challenging pricing environment and higher input and labor costs, but earnings are still going up.
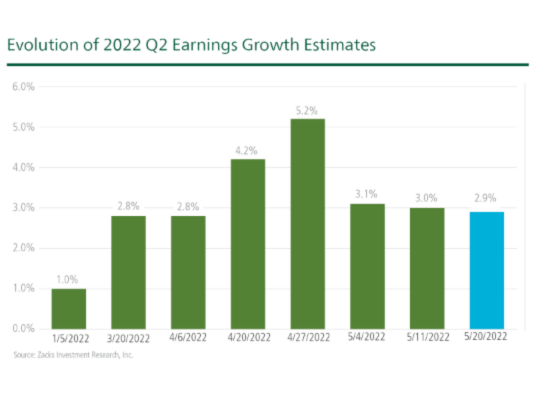
It’s also true that while the earnings picture has shifted around quite a bit in Q1 because of rising inflation, the war, and lockdowns in China, overall earnings growth estimates for Q2 2022 have not changed all that much. As you can see in the chart below, earnings estimates for Q2 are actually higher today than they were at the start of the year, and they have settled at levels that were being forecast in early April:
To be perfectly fair, however, a good portion of overall earnings strength is coming from the Energy sector. The Q2 earnings estimates for the Zacks Energy sector have increased a staggering +78.5% since the start of January, and +41.7% since the beginning of April. And with an expected $49.9 billion in earnings in Q2, that would mark year-over-year earnings growth of +178.8%. The sector’s full year earnings outlook is even more impressive, with the current aggregate earnings estimate of $182.3 billion, up +107.8% over 2021, and it has increased by an impressive +66.3% since the start of the year.
But it’s not just Energy that is doing well in the current environment. We are also seeing nicely positive earnings revisions in Transportation, Basic Materials, Construction, Consumer Staples, and Autos. It is clear, in my view, that some areas of the economy are thriving with strong consumer demand and the benefits of pricing power, while other sectors are still trying to make adjustments to account for higher costs and shifting consumer behavior. Because again, it’s not necessarily the consumer that’s in a tough spot – it’s companies trying to figure out how to efficiently meet demand and grow profits in the process.
Bottom Line for Investors
The earnings picture is shifting, but I am not seeing the glaring issues that seem to be reported daily in the financial media. In Q1, approximately 77% of S&P 500 companies reported a positive earnings-per-share surprise, which is very much in line with longer-term averages. And yet, companies that were surprised by the upside saw their shares decline in the two days following their earnings release, which is the opposite of what has happened historically. All told, the selling pressure amidst growing earnings has led to the S&P 500 having a forward 12-month P/E ratio of 16.4x, which is lower than the 10-year average.3
As a reminder to readers, no one can know when the market correction will run its course. Corrections (which I still believe this market action represents) can last weeks or months, with rallies giving way to sell-offs and the market often looks like it has no clear direction. But one thing we do know is that equity investors with goals of growth do not want to be on the sidelines when the correction does indeed end. Since 1974, the S&P 500 has jumped an average of +8% one month after a correction bottom, and more than +24% a year after a correction bottom.4
Disclosure
2 Wall Street Journal. May 23, 2022. https://www.wsj.com/articles/americans-reported-strong-personal-finances-late-last-year-fed-finds-11653317014
3 Zacks.com. May 20, 2022. https://www.zacks.com/commentary/1927310/breaking-down-the-earnings-outlook-after-retailers-disappoint
4 Charles Schwab. February 25, 2022. https://intelligent.schwab.com/article/stock-market-corrections-not-uncommon#:~:text=These%20occasional%20pullbacks%20have%20historically,than%2024%25%20one%20year%20later
DISCLOSURE
Past performance is no guarantee of future results. Inherent in any investment is the potential for loss.
Zacks Investment Management, Inc. is a wholly-owned subsidiary of Zacks Investment Research. Zacks Investment Management is an independent Registered Investment Advisory firm and acts as an investment manager for individuals and institutions. Zacks Investment Research is a provider of earnings data and other financial data to institutions and to individuals.
This material is being provided for informational purposes only and nothing herein constitutes investment, legal, accounting or tax advice, or a recommendation to buy, sell or hold a security. Do not act or rely upon the information and advice given in this publication without seeking the services of competent and professional legal, tax, or accounting counsel. Publication and distribution of this article is not intended to create, and the information contained herein does not constitute, an attorney-client relationship. No recommendation or advice is being given as to whether any investment or strategy is suitable for a particular investor. It should not be assumed that any investments in securities, companies, sectors or markets identified and described were or will be profitable. All information is current as of the date of herein and is subject to change without notice. Any views or opinions expressed may not reflect those of the firm as a whole.
Any projections, targets, or estimates in this report are forward looking statements and are based on the firm’s research, analysis, and assumptions. Due to rapidly changing market conditions and the complexity of investment decisions, supplemental information and other sources may be required to make informed investment decisions based on your individual investment objectives and suitability specifications. All expressions of opinions are subject to change without notice. Clients should seek financial advice regarding the appropriateness of investing in any security or investment strategy discussed in this presentation.
Certain economic and market information contained herein has been obtained from published sources prepared by other parties. Zacks Investment Management does not assume any responsibility for the accuracy or completeness of such information. Further, no third party has assumed responsibility for independently verifying the information contained herein and accordingly no such persons make any representations with respect to the accuracy, completeness or reasonableness of the information provided herein. Unless otherwise indicated, market analysis and conclusions are based upon opinions or assumptions that Zacks Investment Management considers to be reasonable. Any investment inherently involves a high degree of risk, beyond any specific risks discussed herein.
The S&P 500 Index is a well-known, unmanaged index of the prices of 500 large-company common stocks, mainly blue-chip stocks, selected by Standard & Poor’s. The S&P 500 Index assumes reinvestment of dividends but does not reflect advisory fees. The volatility of the benchmark may be materially different from the individual performance obtained by a specific investor. An investor cannot invest directly in an index.
The Russell 1000 Growth Index is a well-known, unmanaged index of the prices of 1000 large-company growth common stocks selected by Russell. The Russell 1000 Growth Index assumes reinvestment of dividends but does not reflect advisory fees. An investor cannot invest directly in an index. The volatility of the benchmark may be materially different from the individual performance obtained by a specific investor.
Nasdaq Composite Index is the market capitalization-weighted index of over 3,300 common equities listed on the Nasdaq stock exchange. The types of securities in the index include American depositary receipts, common stocks, real estate investment trusts (REITs) and tracking stocks, as well as limited partnership interests. The index includes all Nasdaq-listed stocks that are not derivatives, preferred shares, funds, exchange-traded funds (ETFs) or debenture securities. An investor cannot invest directly in an index. The volatility of the benchmark may be materially different from the individual performance obtained by a specific investor.
The Dow Jones Industrial Average measures the daily stock market movements of 30 U.S. publicly-traded companies listed on the NASDAQ or the New York Stock Exchange (NYSE). The 30 publicly-owned companies are considered leaders in the United States economy. An investor cannot directly invest in an index. The volatility of the benchmark may be materially different from the individual performance obtained by a specific investor.