Earnings season is off to a mixed start for Q2. With 60 companies reporting as I write, total earnings are down -11% from Q2 2021, even though revenues jumped 6.6% higher. 73.3% of reporting companies have beat earnings expectations, which is about in line with longer-term averages.
The earnings decline of -11% looks bad at first glance, which may make it confusing that the stock market has been rallying higher as earnings reports hit the tape. But one of the key takeaways so far, in my view, is that reported earnings have not been as bad as many analysts feared – and that’s good news. Oftentimes all the market needs to establish support is for there to be a gap between reality and expectations, which I think is what we’re seeing so far.1
It is also important to remember that excluding the Energy sector, companies in the S&P 500 have seen valuations reset lower, likely in anticipation of moderating earnings and declining profit margins. Recent activity may imply that prices were discounted too low relative to actual earnings outcomes and projections.2
________________________________________________________________________
In Addition to Earnings, What Other Data Should You Be Watching?
It can be easy to get caught up in fear-based headlines that constantly focus on attention-grabbing topics. But there are many other important factors impacting the markets that you should be keeping an eye on!
Therefore, instead of sitting on the sidelines and potentially missing upward movement, I recommend making decisions now based on fundamentals.
To help you do this, I am offering all readers our just-released Stock Market Outlook report. This report contains some of our key forecasts to consider such as:
- U.S. Macro Outlook
- What fundamentals are U.S. stock markets pricing in with ‘22 and ‘23?
- What of U.S. GDP Growth?
- Zacks forecasts for the remainder of the year
- Zacks rank S&P 500 sector picks
- And much more
If you have $500,000 or more to invest and want to learn more about these forecasts, click on the link below to get your free report today!
IT’S FREE. Download the Just-Released August 2022 Stock Market Outlook3
________________________________________________________________________
Case in point: in the first six months of the year, the S&P 500 fell -20.6%. But when you break down what drove the decline in the first half, it’s clear to see the outsize role of multiple contractions:
- Earnings growth: +6.7%
- Multiple growth: -27.3%
Share prices have been coming down hard even as earnings have been ok, and the market may be conceding that the situation is not as dire as previously thought. In all, earnings are expected to be up 3.1% in the second quarter with improvements over the balance of the year:
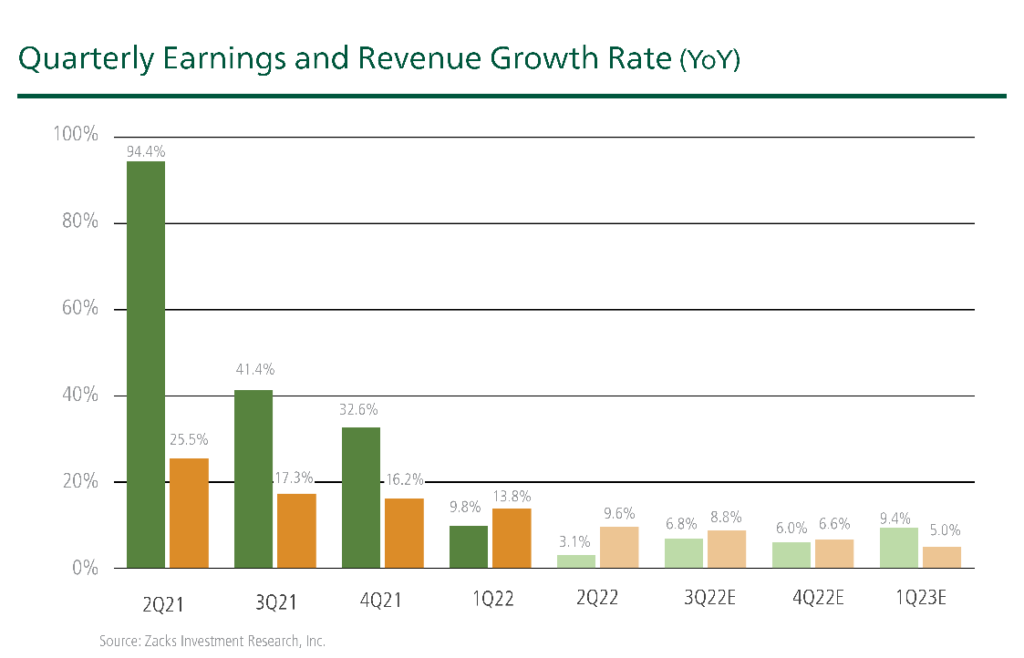
A closer look at Q2 earnings to date also tells us that there is a disproportionate drag coming from the Financials sector, but not the kind of weakness that raises alarm bells about future profitability or problems in credit markets.
In Q2 2021, the Financials companies saw big reserve releases that drove a huge boost in earnings, which has made for tough comparisons this quarter. If we were to exclude the impact of reserves, Q2 earnings for reporting Financials companies would be essentially flat from the year-ago period, as declines in investment banking and mortgages were offset by net interest income and trading gains. What’s more, when we exclude Financials companies from Q2-22 earnings to date, we see earnings growth of +12% – a significant swing from the headline -11% number.
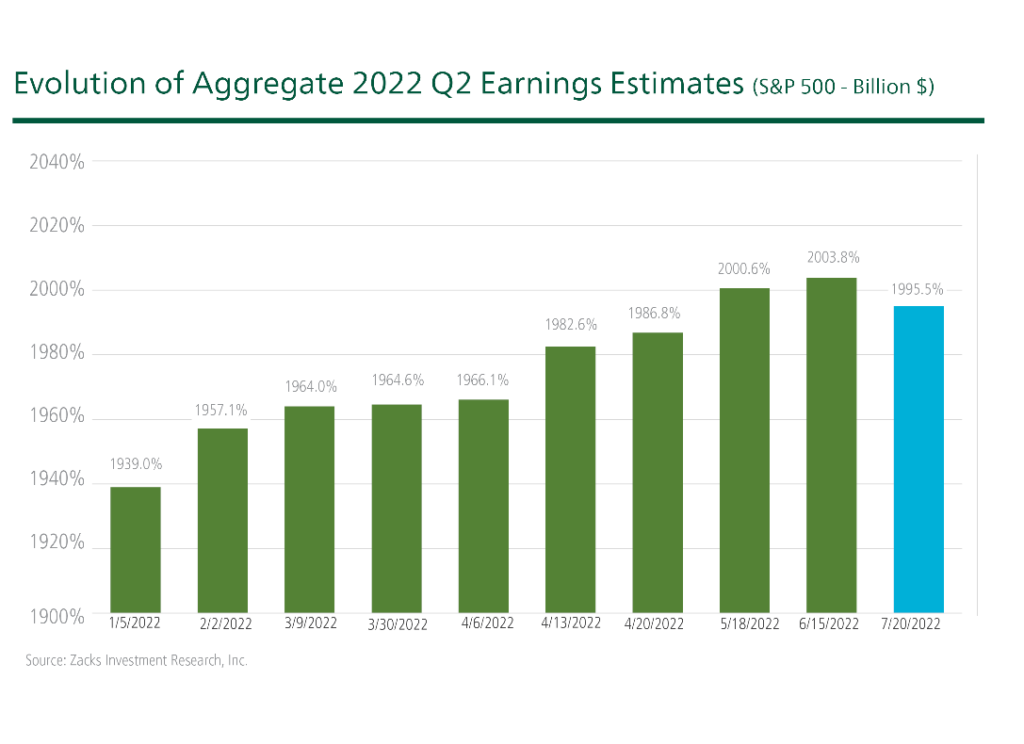
I think it is also worth noting that even with the war and rapidly rising inflation in 2022 year-to-date, full-year earnings estimates are still higher today than they were at the start of the year. I just do not see how this lines up with some of the gloomy economic narratives out there.
Earnings are not as bad as the worst-case scenarios feared, but I also think it’s fair to say that we will likely need more time – perhaps following the Q3-22 reporting cycle in October – to receive clarity on how earnings revisions will shape up. In the second quarter, we have already seen some estimated cuts, but they are nowhere near what would be consistent with a significant economic slowdown.
Bottom Line for Investors
We think the full-year 2022 earnings growth picture will be better than most expect. But to be fair, a meaningful part of positive earnings figures will be due to soaring profit growth in the Energy sector. If we exclude the Energy sector from our full-year estimates, the S&P 500 is expected to post 2022 earnings growth of +2.5% – a pretty modest figure.
More earnings reports are needed and I think it will be key to see what happens with revisions in Q3. But my bottom line so far is that we’re seeing a challenging earnings picture, but not a dire one that generally accompanies a very weak economy.
In times like this, I advise that you focus on the fundamentals and key data points that positively contribute to your financial future. To help, I am offering all readers our Just-Released August 2022 Stock Market Outlook Report.
This special report was created to help you better prepare your investments for any market changes. It contains some of our key forecasts to consider such as:
- U.S. Macro Outlook
- What fundamentals are U.S. stock markets pricing in with ‘22 and ‘23?
- What of U.S. GDP Growth?
- Zacks forecasts for the remainder of the year
- Zacks rank S&P 500 sector picks
- And much more
If you have $500,000 or more to invest and want to learn more about these forecasts, click on the link below to get your free report today!
Disclosure
2 Wall Street Journal. July 24, 2022. https://www.wsj.com/articles/weak-earnings-reports-arent-fazing-investors-after-brutal-year-for-stocks-11658615669?mod=markets_major_pos11
3 Zacks Investment Management reserves the right to amend the terms or rescind the free Stock Market Outlook offer at any time and for any reason at its discretion.
4 Zacks Investment Management reserves the right to amend the terms or rescind the free Stock Market Outlook offer at any time and for any reason at its discretion.
DISCLOSURE
Past performance is no guarantee of future results. Inherent in any investment is the potential for loss.
Zacks Investment Management, Inc. is a wholly-owned subsidiary of Zacks Investment Research. Zacks Investment Management is an independent Registered Investment Advisory firm and acts as an investment manager for individuals and institutions. Zacks Investment Research is a provider of earnings data and other financial data to institutions and to individuals.
This material is being provided for informational purposes only and nothing herein constitutes investment, legal, accounting or tax advice, or a recommendation to buy, sell or hold a security. Do not act or rely upon the information and advice given in this publication without seeking the services of competent and professional legal, tax, or accounting counsel. Publication and distribution of this article is not intended to create, and the information contained herein does not constitute, an attorney-client relationship. No recommendation or advice is being given as to whether any investment or strategy is suitable for a particular investor. It should not be assumed that any investments in securities, companies, sectors or markets identified and described were or will be profitable. All information is current as of the date of herein and is subject to change without notice. Any views or opinions expressed may not reflect those of the firm as a whole.
Any projections, targets, or estimates in this report are forward looking statements and are based on the firm’s research, analysis, and assumptions. Due to rapidly changing market conditions and the complexity of investment decisions, supplemental information and other sources may be required to make informed investment decisions based on your individual investment objectives and suitability specifications. All expressions of opinions are subject to change without notice. Clients should seek financial advice regarding the appropriateness of investing in any security or investment strategy discussed in this presentation.
Certain economic and market information contained herein has been obtained from published sources prepared by other parties. Zacks Investment Management does not assume any responsibility for the accuracy or completeness of such information. Further, no third party has assumed responsibility for independently verifying the information contained herein and accordingly no such persons make any representations with respect to the accuracy, completeness or reasonableness of the information provided herein. Unless otherwise indicated, market analysis and conclusions are based upon opinions or assumptions that Zacks Investment Management considers to be reasonable. Any investment inherently involves a high degree of risk, beyond any specific risks discussed herein.
The S&P 500 Index is a well-known, unmanaged index of the prices of 500 large-company common stocks, mainly blue-chip stocks, selected by Standard & Poor’s. The S&P 500 Index assumes reinvestment of dividends but does not reflect advisory fees. The volatility of the benchmark may be materially different from the individual performance obtained by a specific investor. An investor cannot invest directly in an index.
The Russell 1000 Growth Index is a well-known, unmanaged index of the prices of 1000 large-company growth common stocks selected by Russell. The Russell 1000 Growth Index assumes reinvestment of dividends but does not reflect advisory fees. An investor cannot invest directly in an index. The volatility of the benchmark may be materially different from the individual performance obtained by a specific investor.
Nasdaq Composite Index is the market capitalization-weighted index of over 3,300 common equities listed on the Nasdaq stock exchange. The types of securities in the index include American depositary receipts, common stocks, real estate investment trusts (REITs) and tracking stocks, as well as limited partnership interests. The index includes all Nasdaq-listed stocks that are not derivatives, preferred shares, funds, exchange-traded funds (ETFs) or debenture securities. An investor cannot invest directly in an index. The volatility of the benchmark may be materially different from the individual performance obtained by a specific investor.
The Dow Jones Industrial Average measures the daily stock market movements of 30 U.S. publicly-traded companies listed on the NASDAQ or the New York Stock Exchange (NYSE). The 30 publicly-owned companies are considered leaders in the United States economy. An investor cannot directly invest in an index. The volatility of the benchmark may be materially different from the individual performance obtained by a specific investor.