The Federal Reserve is actively trying to curb demand in the economy by raising rates, and all the talk is about whether they can usher a ‘soft-landing’ without triggering a deep recession. So, the Fed will be a key factor to watch in the second half of the year. But I also have three other economic fundamentals investors should put on their watchlists, as they could be key in determining the path of the economy and markets over the next year.
Economic Fundamental #1: The Yield Curve
As a quick refresher, the yield curve represents the difference between long-term and short-term interest rates, which also serves as a proxy for loan profitability for banks. Since banks borrow at short-duration rates and lend at long-term rates (generally speaking), a steep yield curve creates higher net interest margins, which usually results in more credit, loans, and economic activity. On the flip side, an inverted yield curve signals it is more expensive to borrow money short-term than long-term, which means something is likely awry in the credit markets.
Historically, the yield curve has been a good forward-looking indicator for the economy, which is why rapidly rising short-duration U.S. Treasury bond yields are worth watching closely. In the chart below, the yield curve is presented as the 10-year U.S. Treasury bond yield minus the 3-month U.S. Treasury bond yield – the preferred measure. A declining line means the yield curve is flattening, and if the line falls below 0%, it means the yield curve is inverted. As seen below, the yield curve is clearly in a flattening pattern and close to inverting, making it a key indicator to watch in 2022.
________________________________________________________________________
Are You Managing Your Expectations in a Market Full of Surprises?
The first half of 2022 has been quite the ride for investors. From high inflation to recession talks, it doesn’t look like the end is near, yet.
Instead of sitting on the sidelines and potentially missing upward movement in the second half, I recommend that investors focus on the fundamentals when making financial decisions.
To help, I am offering all readers our just-released Stock Market Outlook report. This report contains some of our key forecasts to consider such as:
- U.S. Macro Outlook
- What fundamentals are U.S. stock markets pricing in with ‘22 and ‘23?
- What of U.S. GDP Growth?
- Zacks forecasts for the remainder of the year
- Zacks rank S&P 500 sector picks
- And much more
If you have $500,000 or more to invest and want to learn more about these forecasts, click on the link below to get your free report today!
IT’S FREE. Download the Just-Released Stock Market Outlook1
________________________________________________________________________
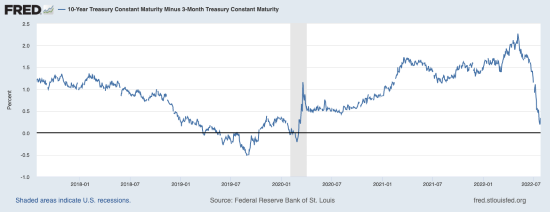
An inverted yield curve signals credit markets could come under strain, but it is not an immediate indicator of recession and/or bear market. There is usually time for investors to act.
Economic Fundamental #2: Leading Economic Indicators
The Conference Board Leading Economic Index is a pretty solid indicator for future economic activity. Because the index measures leading indicators like New Orders, Building Permits, Jobless Claims, Credit Spreads, and the stock market, it offers a comprehensive picture of expectations for future economic activity. A high and rising LEI almost always signals economic expansion ahead.3
In June, however, the LEI fell by 0.8% to an index reading of 117.1, which is still quite high relative to the years leading up to the pandemic but also marks four months of consecutive decline. In the first half of the year, the LEI fell 1.8%, which was a reversal from the 3.3% growth posted in the second half of 2021. Whether or not the LEI recovers or continues to decline in the second half will be a key indicator to watch in the second half, and could offer the clearest clue of a possible recession later in 2022 or early 2023.
Economic Fundamental #3: Earnings
Finally, there is the ever-important economic fundamental of corporate earnings, which are the single biggest driver of stock market returns, in my view. With roughly half of S&P 500 companies reporting, total earnings are up +1.4% from the same period last year on +11% higher revenues, with 75.5% beating EPS estimates and 65.7% beating revenue estimates. This is a slightly lower beats percentage than we typically see from this group, but the silver lining is that some of the key results were not as bad as many feared – driving stocks to rally.4
Looking ahead, inflationary pressures and supply-chain challenges will continue to factor for companies, but we are also hearing a lot more about the negative impact of the strong US dollar (which I will write about next week) and signs of weakness among lower-income consumers. How these issues continue to impact shifting earnings estimates will be crucial for investors to track.
Bottom Line for Investors
It is important to remember that the stock market is a discounter of future economic conditions – not economic conditions today. That’s why the three economic fundamentals I think investors should keep an eye on in the second half of 2022 are all leading indicators, not lagging or coincident indicators. Looking ahead, I do not see severe warning signs appearing just yet, but the environment is becoming more challenging.
To be prepared for any market outcome, I recommend that investors focus on data that contributes to their financial goals. To help you get started, I am offering all readers our Just-Released Stock Market Outlook Report.
This special report was created to help you better prepare your investments for any market changes. It contains some of our key forecasts to consider such as:
- U.S. Macro Outlook
- What fundamentals are U.S. stock markets pricing in with ‘22 and ‘23?
- What of U.S. GDP Growth?
- Zacks forecasts for the remainder of the year
- Zacks rank S&P 500 sector picks
- And much more
If you have $500,000 or more to invest and want to learn more about these forecasts, click on the link below to get your free report today!
Disclosure
2 Fred Economic Data. July 29, 2022. https://fred.stlouisfed.org/series/T10Y3M#
3 Conference Board. July 21, 2022. https://www.conference-board.org/topics/us-leading-indicators
4 Zacks.com. July 28, 2022. https://www.zacks.com/commentary/1960253/taking-stock-of-the-earnings-picture
5 Zacks Investment Management reserves the right to amend the terms or rescind the free Stock Market Outlook offer at any time and for any reason at its discretion.
DISCLOSURE
Past performance is no guarantee of future results. Inherent in any investment is the potential for loss.
Zacks Investment Management, Inc. is a wholly-owned subsidiary of Zacks Investment Research. Zacks Investment Management is an independent Registered Investment Advisory firm and acts as an investment manager for individuals and institutions. Zacks Investment Research is a provider of earnings data and other financial data to institutions and to individuals.
This material is being provided for informational purposes only and nothing herein constitutes investment, legal, accounting or tax advice, or a recommendation to buy, sell or hold a security. Do not act or rely upon the information and advice given in this publication without seeking the services of competent and professional legal, tax, or accounting counsel. Publication and distribution of this article is not intended to create, and the information contained herein does not constitute, an attorney-client relationship. No recommendation or advice is being given as to whether any investment or strategy is suitable for a particular investor. It should not be assumed that any investments in securities, companies, sectors or markets identified and described were or will be profitable. All information is current as of the date of herein and is subject to change without notice. Any views or opinions expressed may not reflect those of the firm as a whole.
Any projections, targets, or estimates in this report are forward looking statements and are based on the firm’s research, analysis, and assumptions. Due to rapidly changing market conditions and the complexity of investment decisions, supplemental information and other sources may be required to make informed investment decisions based on your individual investment objectives and suitability specifications. All expressions of opinions are subject to change without notice. Clients should seek financial advice regarding the appropriateness of investing in any security or investment strategy discussed in this presentation.
Certain economic and market information contained herein has been obtained from published sources prepared by other parties. Zacks Investment Management does not assume any responsibility for the accuracy or completeness of such information. Further, no third party has assumed responsibility for independently verifying the information contained herein and accordingly no such persons make any representations with respect to the accuracy, completeness or reasonableness of the information provided herein. Unless otherwise indicated, market analysis and conclusions are based upon opinions or assumptions that Zacks Investment Management considers to be reasonable. Any investment inherently involves a high degree of risk, beyond any specific risks discussed herein.
The S&P 500 Index is a well-known, unmanaged index of the prices of 500 large-company common stocks, mainly blue-chip stocks, selected by Standard & Poor’s. The S&P 500 Index assumes reinvestment of dividends but does not reflect advisory fees. The volatility of the benchmark may be materially different from the individual performance obtained by a specific investor. An investor cannot invest directly in an index.
The Russell 1000 Growth Index is a well-known, unmanaged index of the prices of 1000 large-company growth common stocks selected by Russell. The Russell 1000 Growth Index assumes reinvestment of dividends but does not reflect advisory fees. An investor cannot invest directly in an index. The volatility of the benchmark may be materially different from the individual performance obtained by a specific investor.
Nasdaq Composite Index is the market capitalization-weighted index of over 3,300 common equities listed on the Nasdaq stock exchange. The types of securities in the index include American depositary receipts, common stocks, real estate investment trusts (REITs) and tracking stocks, as well as limited partnership interests. The index includes all Nasdaq-listed stocks that are not derivatives, preferred shares, funds, exchange-traded funds (ETFs) or debenture securities. An investor cannot invest directly in an index. The volatility of the benchmark may be materially different from the individual performance obtained by a specific investor.
The Dow Jones Industrial Average measures the daily stock market movements of 30 U.S. publicly-traded companies listed on the NASDAQ or the New York Stock Exchange (NYSE). The 30 publicly-owned companies are considered leaders in the United States economy. An investor cannot directly invest in an index. The volatility of the benchmark may be materially different from the individual performance obtained by a specific investor.